Insights · 1 min read
Usage
Token consumption per model and per user group, and how much of the storage quota each Space uses.
Usage measures consumption rather than engagement: how many tokens were spent, on which models, by which user groups. It answers what the platform is costing you and where that cost is going.
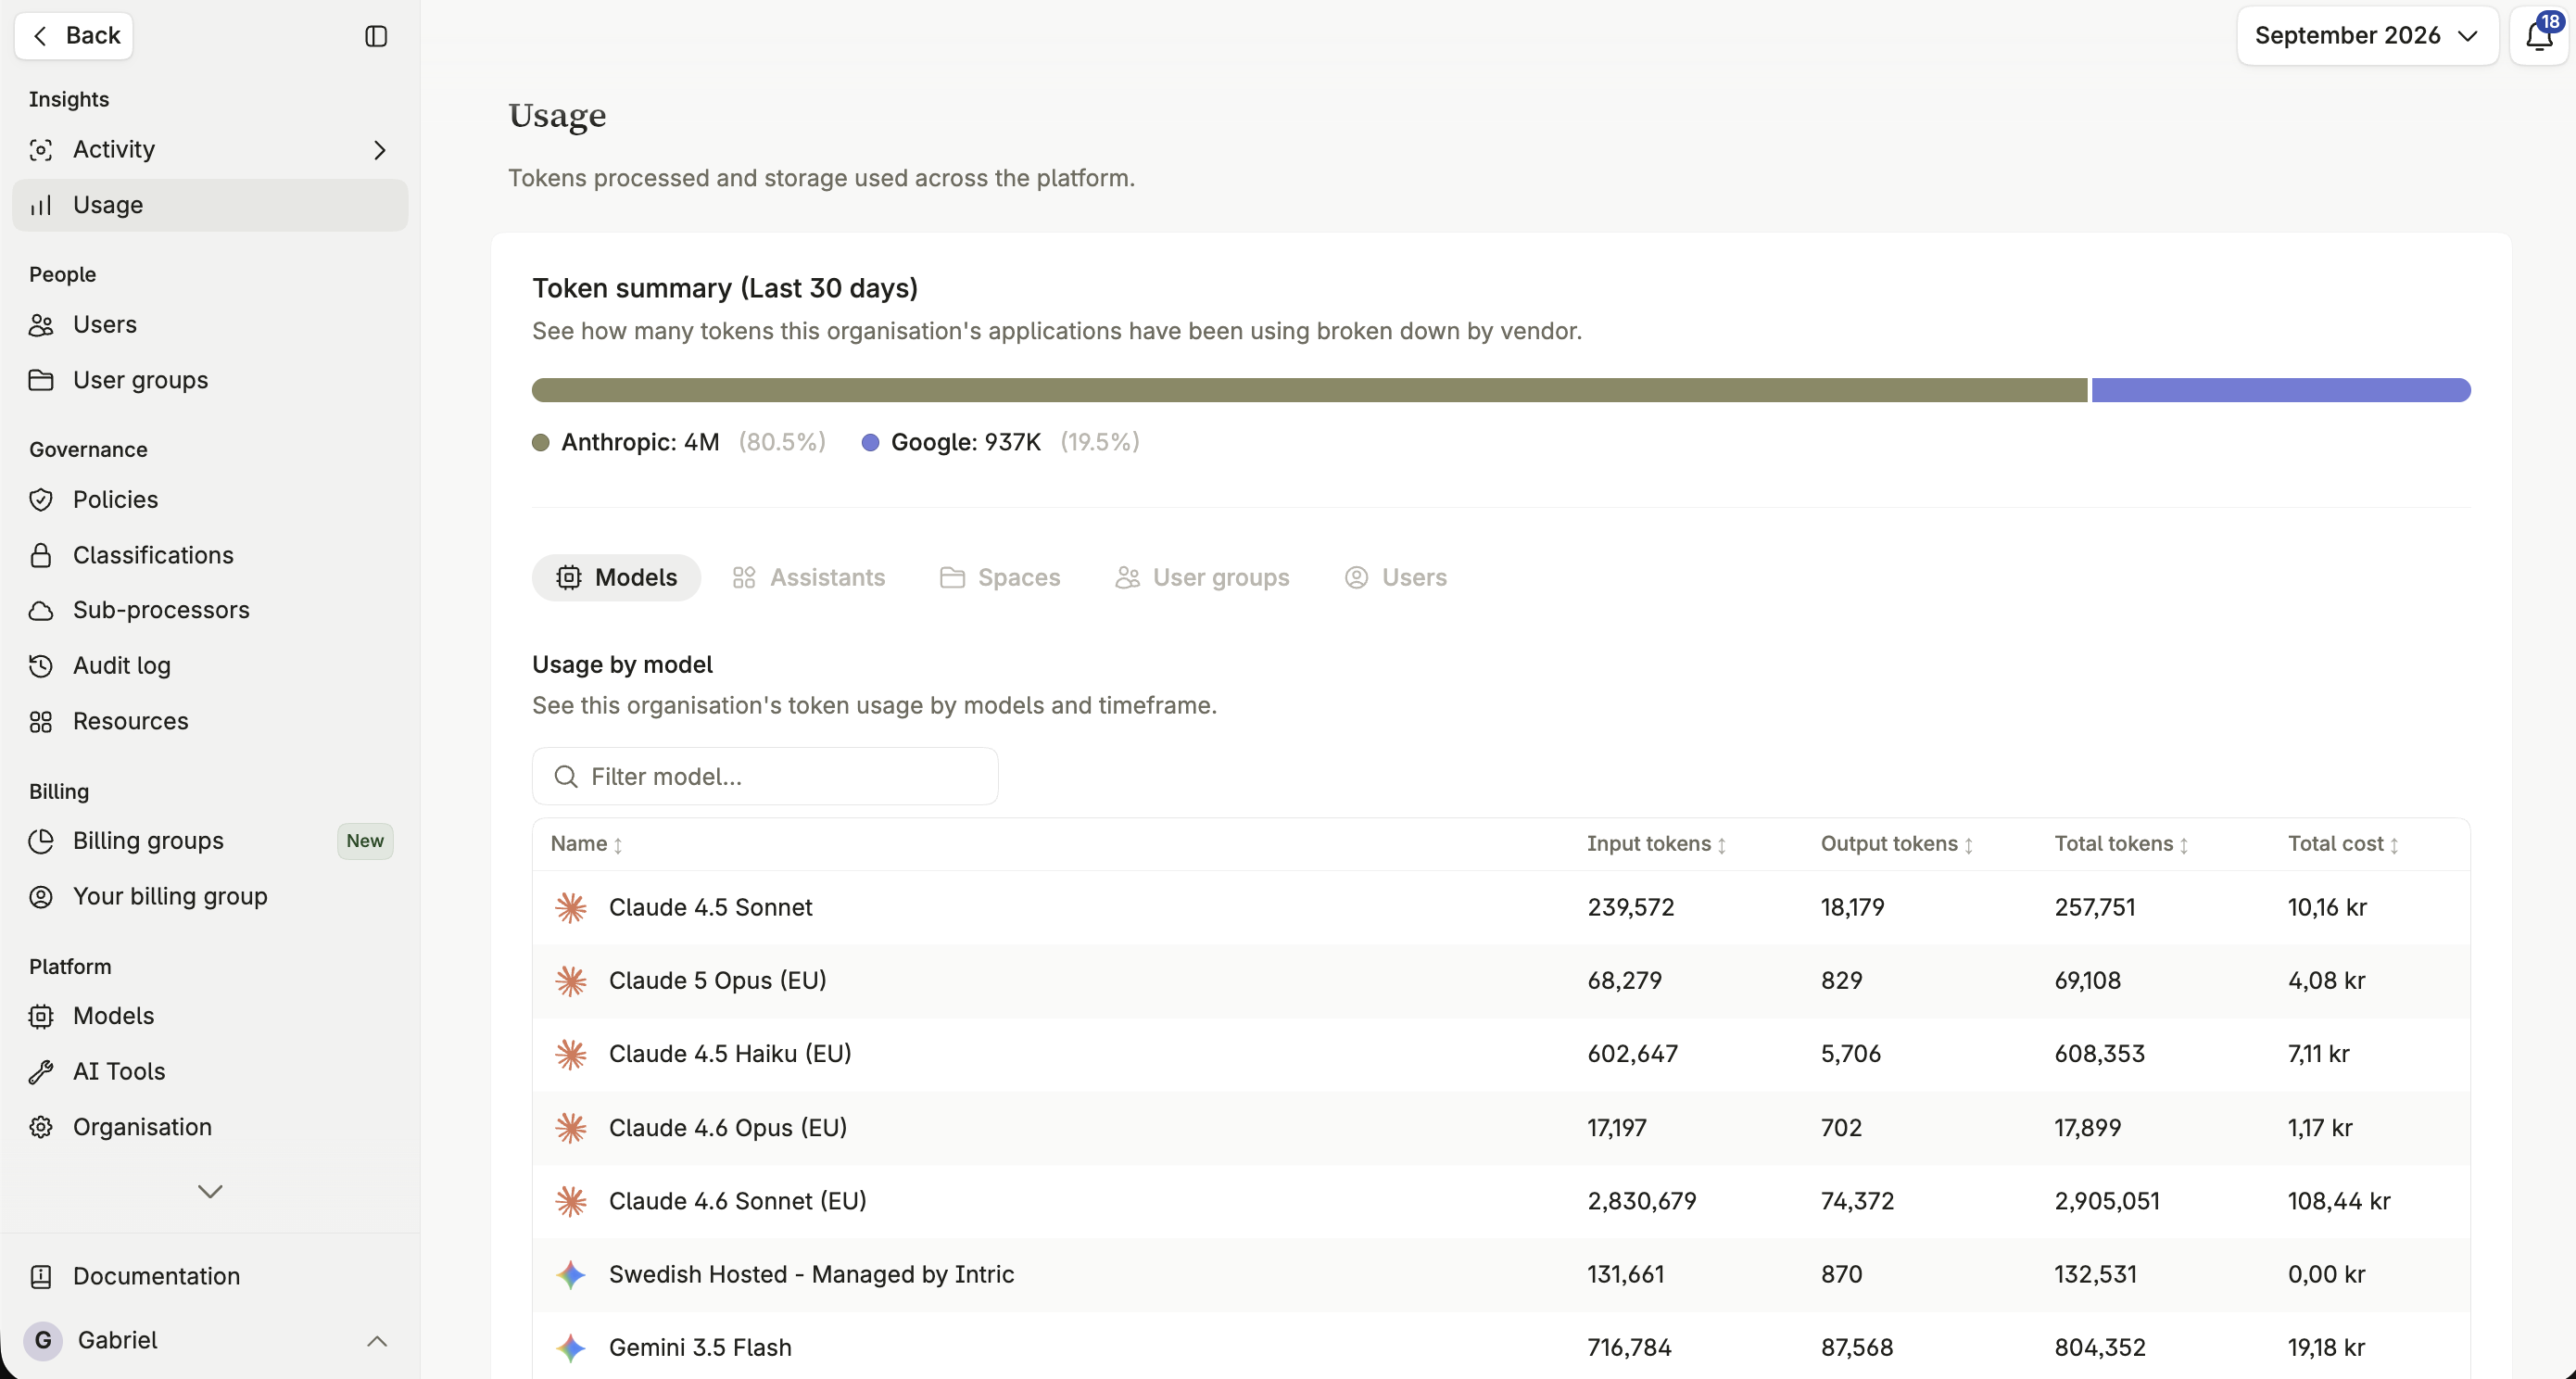
Token usage
Section titled “Token usage”By model
Section titled “By model”Total tokens consumed across your organization, broken down by AI model — useful for understanding which models are driving the most usage and spotting cost patterns.
By user group
Section titled “By user group”Token consumption broken down by user group, answering who is using the platform most rather than what they’re using. Useful for chargeback and cost allocation, spotting groups who aren’t adopting the platform, and planning capacity.
Storage
Section titled “Storage”Storage is the text Intric holds as knowledge in your Spaces, measured against the organization’s quota, 10 GB by default. The table lists every Space and how much of the quota it takes up.
What counts
Section titled “What counts”Only knowledge held in a Space counts:
- Files uploaded to a collection
- Websites Intric crawls
- Knowledge an integration syncs in, for example from a SharePoint library or a Confluence space
Intric counts the text it extracts from each file or page, not the size of the original file. A file that is mostly images takes up far less than its file size suggests.
What doesn’t count
Section titled “What doesn’t count”- Conversations: your messages, the assistant’s answers and the history
- Files uploaded in a conversation
- Attachments on an assistant
- Documents an assistant creates for you
To free up storage, remove files from a collection, a crawled website or integration knowledge from the Space that holds it. Deleting conversations doesn’t change the figure. Collections and websites belong to legacy knowledge, which Intric is retiring; see Legacy knowledge.
Usage or Billing?
Section titled “Usage or Billing?”Usage shows consumption in tokens and storage. Billing translates that consumption into cost and allocates it to a cost center. Use Usage when you need to understand what’s being consumed; use Billing when you need to know what it costs and who should be charged for it. See Billing.
Switch between week, month and quarter, the same selector used across Insights, and export either table as CSV for the current view. See Exporting table data as CSV.